SPACs should be thought of as venture capital in public markets, and we have data to support that thesis.
First, a primer on venture returns. Venture returns typically follow a power law, or 80-20 rule, in which a small number of winners make up the bulk of returns, hopefully more than offsetting a host of mediocre and failed exits.
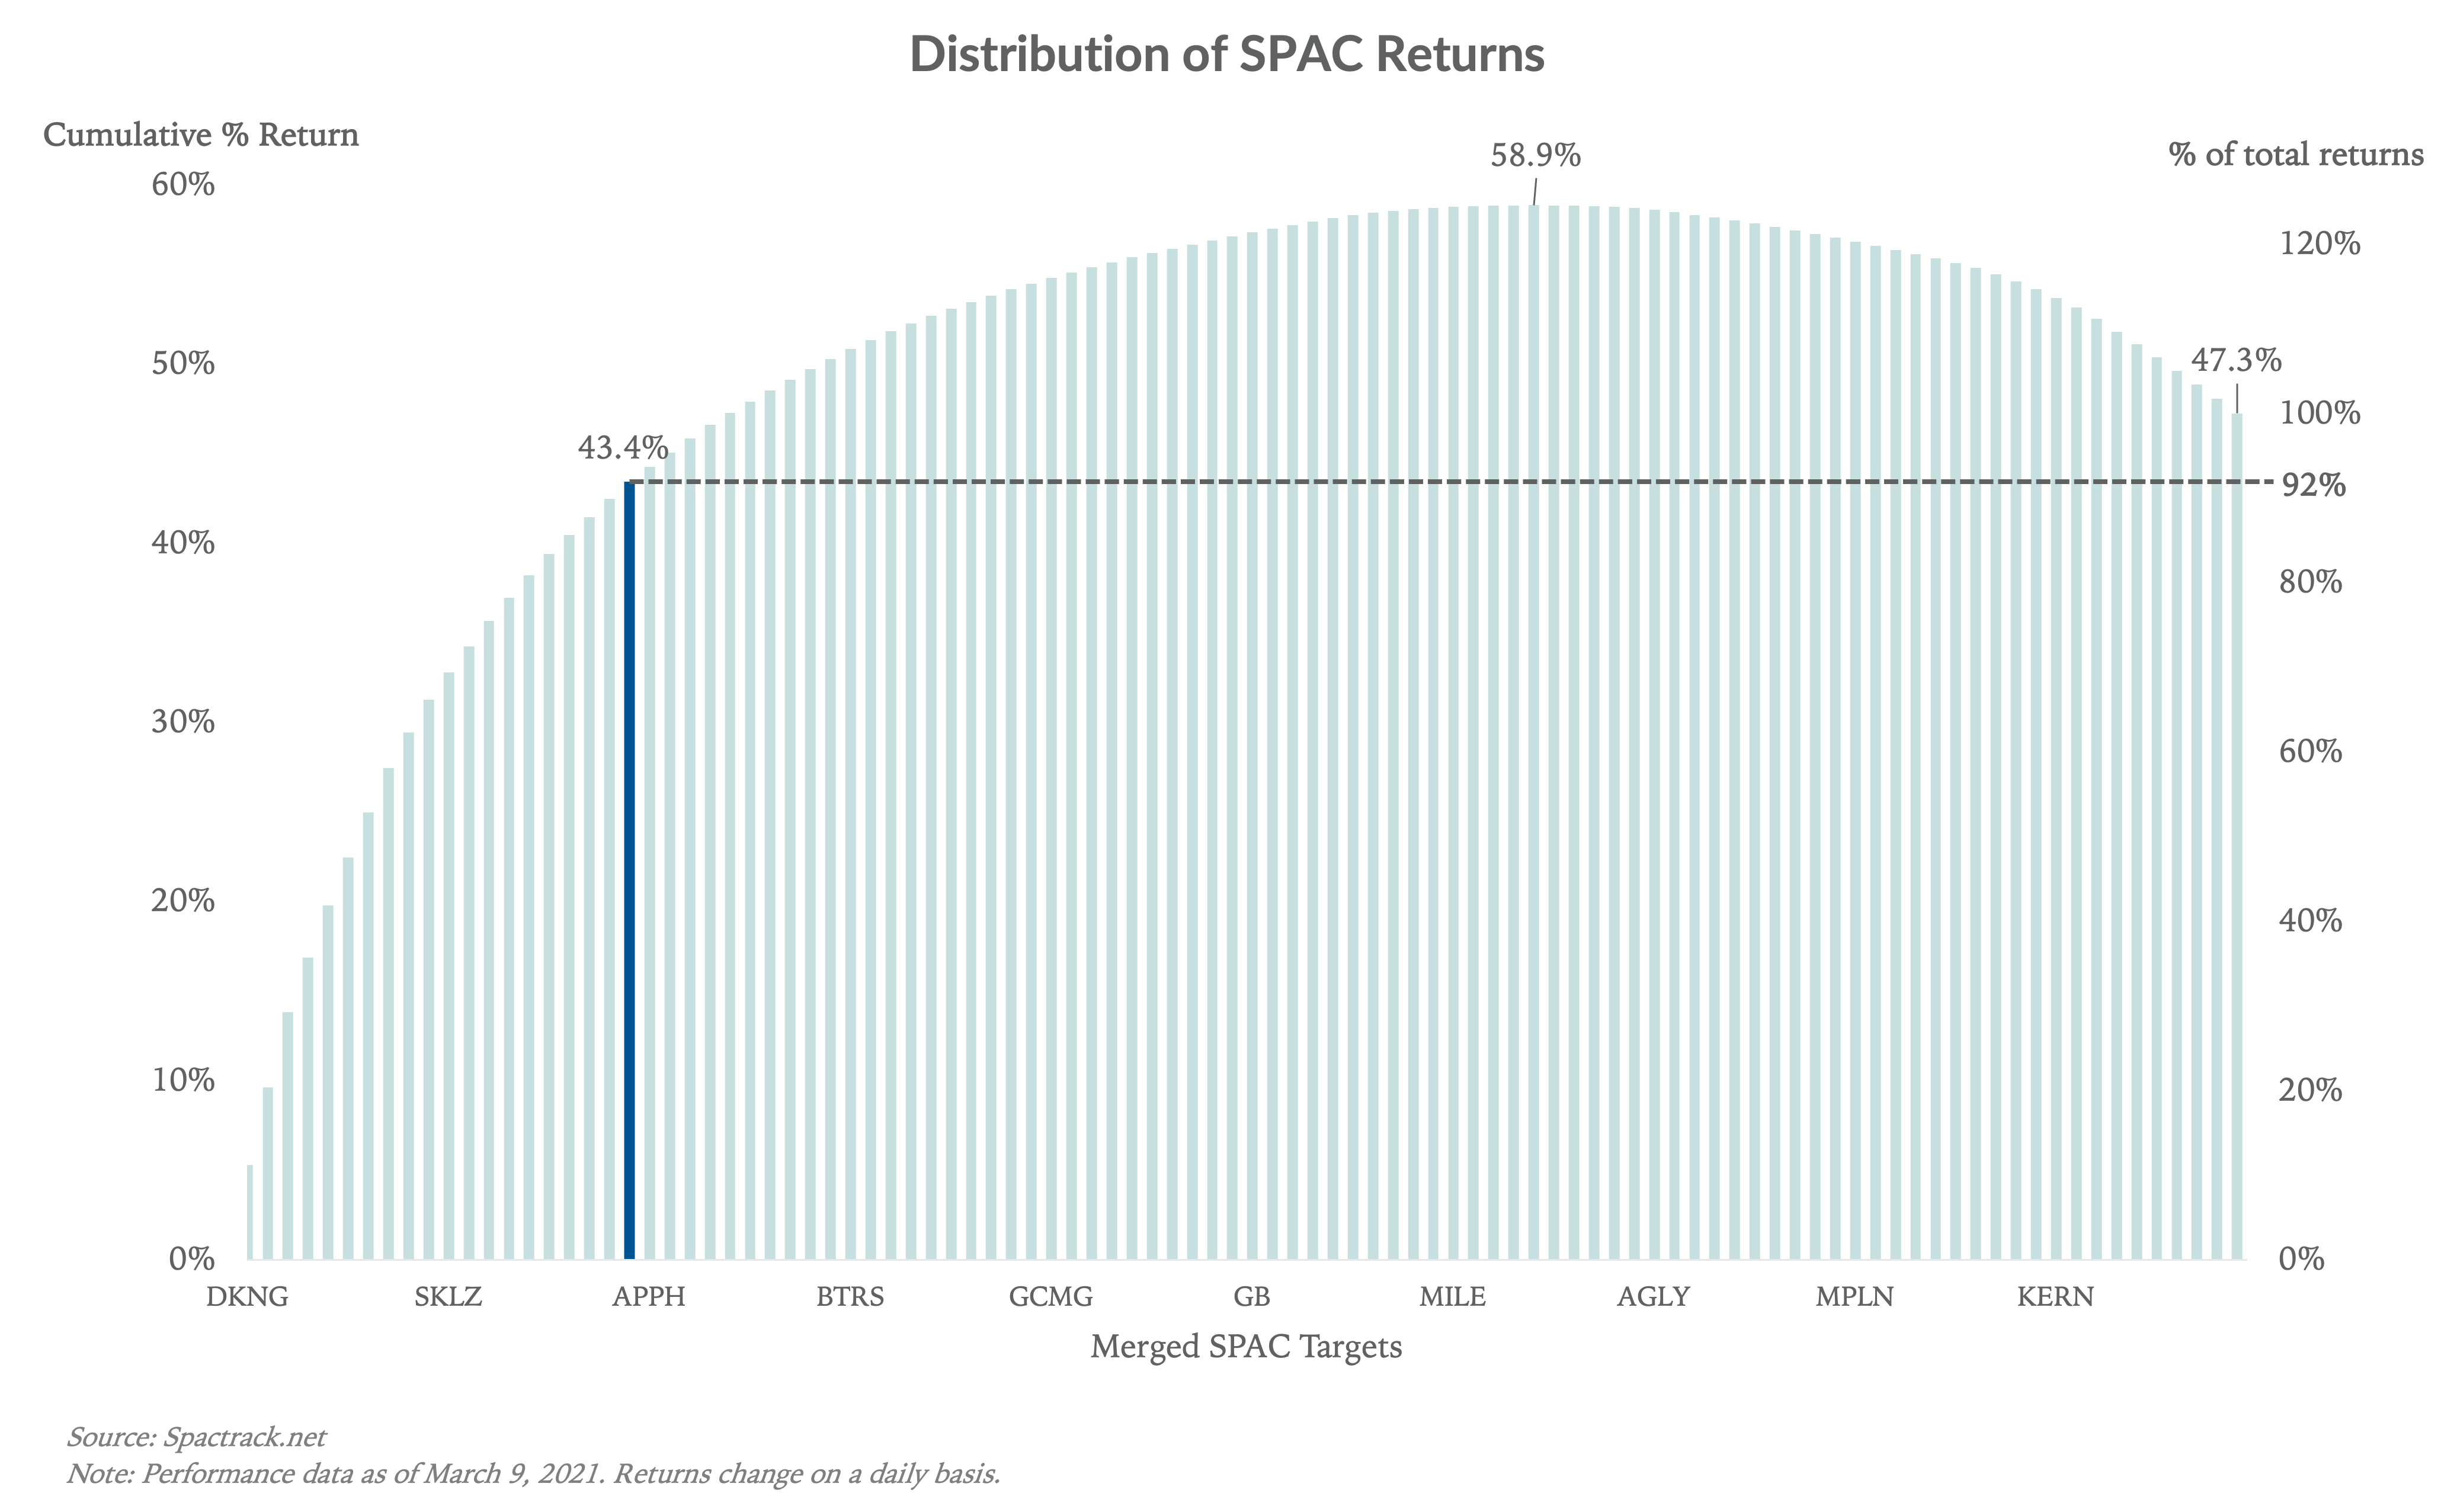
To test our SPACs-are-venture hypothesis, we simulated a portfolio with an equal 1% weighting in each of the 100 SPACs that closed and completed a merger between the beginning of 2019 and the end of February 2021. The 1% position was assumed to start on the respective SPAC’s IPO date. The hypothetical portfolio would have returned 47.3% to date, which includes 35 SPACs that have negative returns (this is why the columns peak well above and then fall back to 100%):

The blue line represents the 20th SPAC from the left, which happens to be AppHarvest (APPH). Following the dotted gray line to the right, we find the top 20% of SPACs provided 92% of total returns or 43.4%. The 65 SPACs in the simulation with positive returns correlate to the peak at 58.9%. When factoring in the 35 SPACs with negative returns, the cumulative total return is brought down to 47.3%. The data suggests that, at least over the last year, SPACs are following a venture capital distribution: a few companies yield outsized returns, many have mediocre returns, and about a third fail (negative returns).
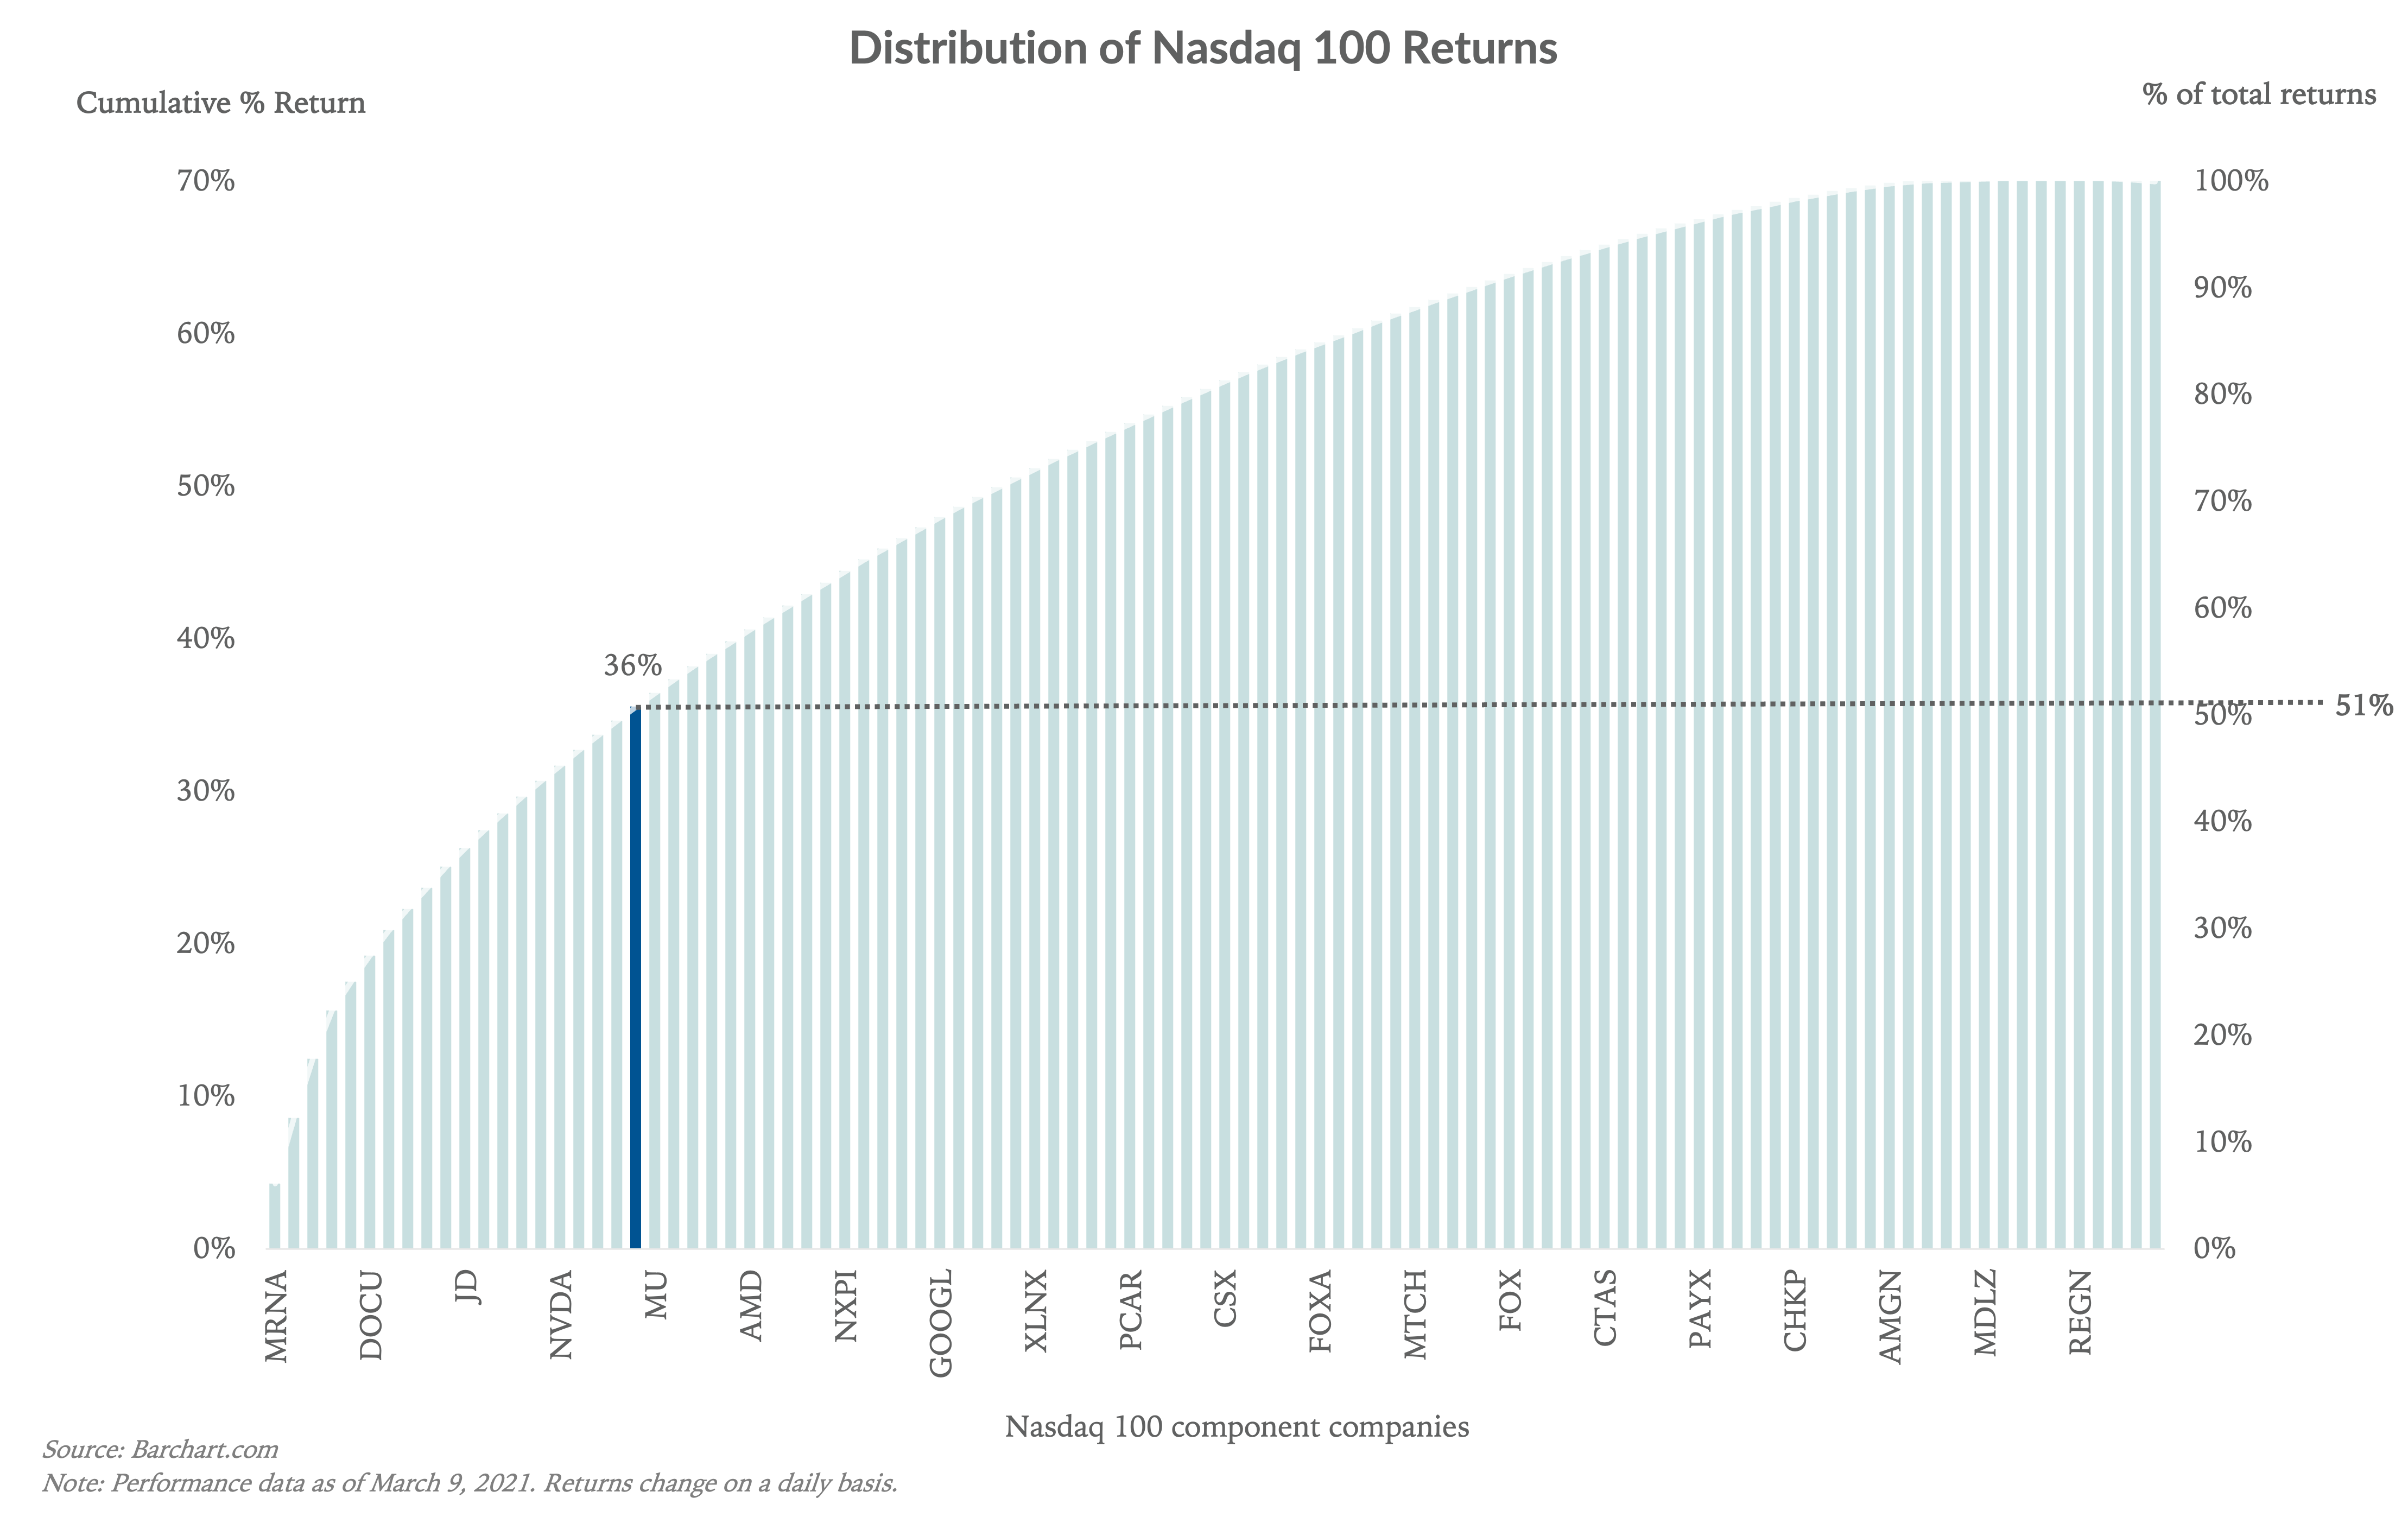
Contrast this to the Nasdaq 100 index and the distribution of returns is very different. Again, we simulated a portfolio with an equal 1% weighting in each of the 100 component companies in the index. We used the % return over the last 52 weeks. Although the selected time periods are different for the Nasdaq versus the SPAC group, this is not important given we are testing the distribution of returns, not the absolute or relative return performance:

The important thing to note is that the upward slop of the Nasdaq returns is much more gradual compared to that of the SPACs. Repeating the exercise we did above, we find the top 20% of Nasdaq components (represented by the blue column) account for 51% of total returns. Only 6 of the Nasdaq components had a negative return, which is why the columns never rise much above 100%. We found a similar distribution when we simulated the component returns of the S&P 500.
The different distributions tell us that SPAC performance to date has been more concentrated in relatively few companies (similar to venture capital), while broader stock market returns appear more distributed. One may argue that some of the SPACs in the study are still relatively new and need time to mature to fairly assess their returns, but we suspect the data may still look fairly similar.
SPACs are not ‘one size fits all’
The resemblance of SPACs to venture capital has led to the idea that all SPACs are speculative with minimal revenue, not to mention profit. In fact, many SPAC targets are established, unglamorous businesses with a record of revenue and profitability. Of the 100 SPAC targets we looked at, 20% were pre-revenue companies while 80% were revenue-generating. For comparison, 19% of traditional IPO issuers in 2020 were pre-revenue companies, according to Paul Hastings, many of which are clinical-stage biotech companies. Of the 80 SPAC targets that had revenue, we estimate the median LTM revenue leading up to the merger was around $150m. According to Professor Jay Ritter’s IPO data, the median LTM sales for traditional IPOs in 2020 was in a similar range.
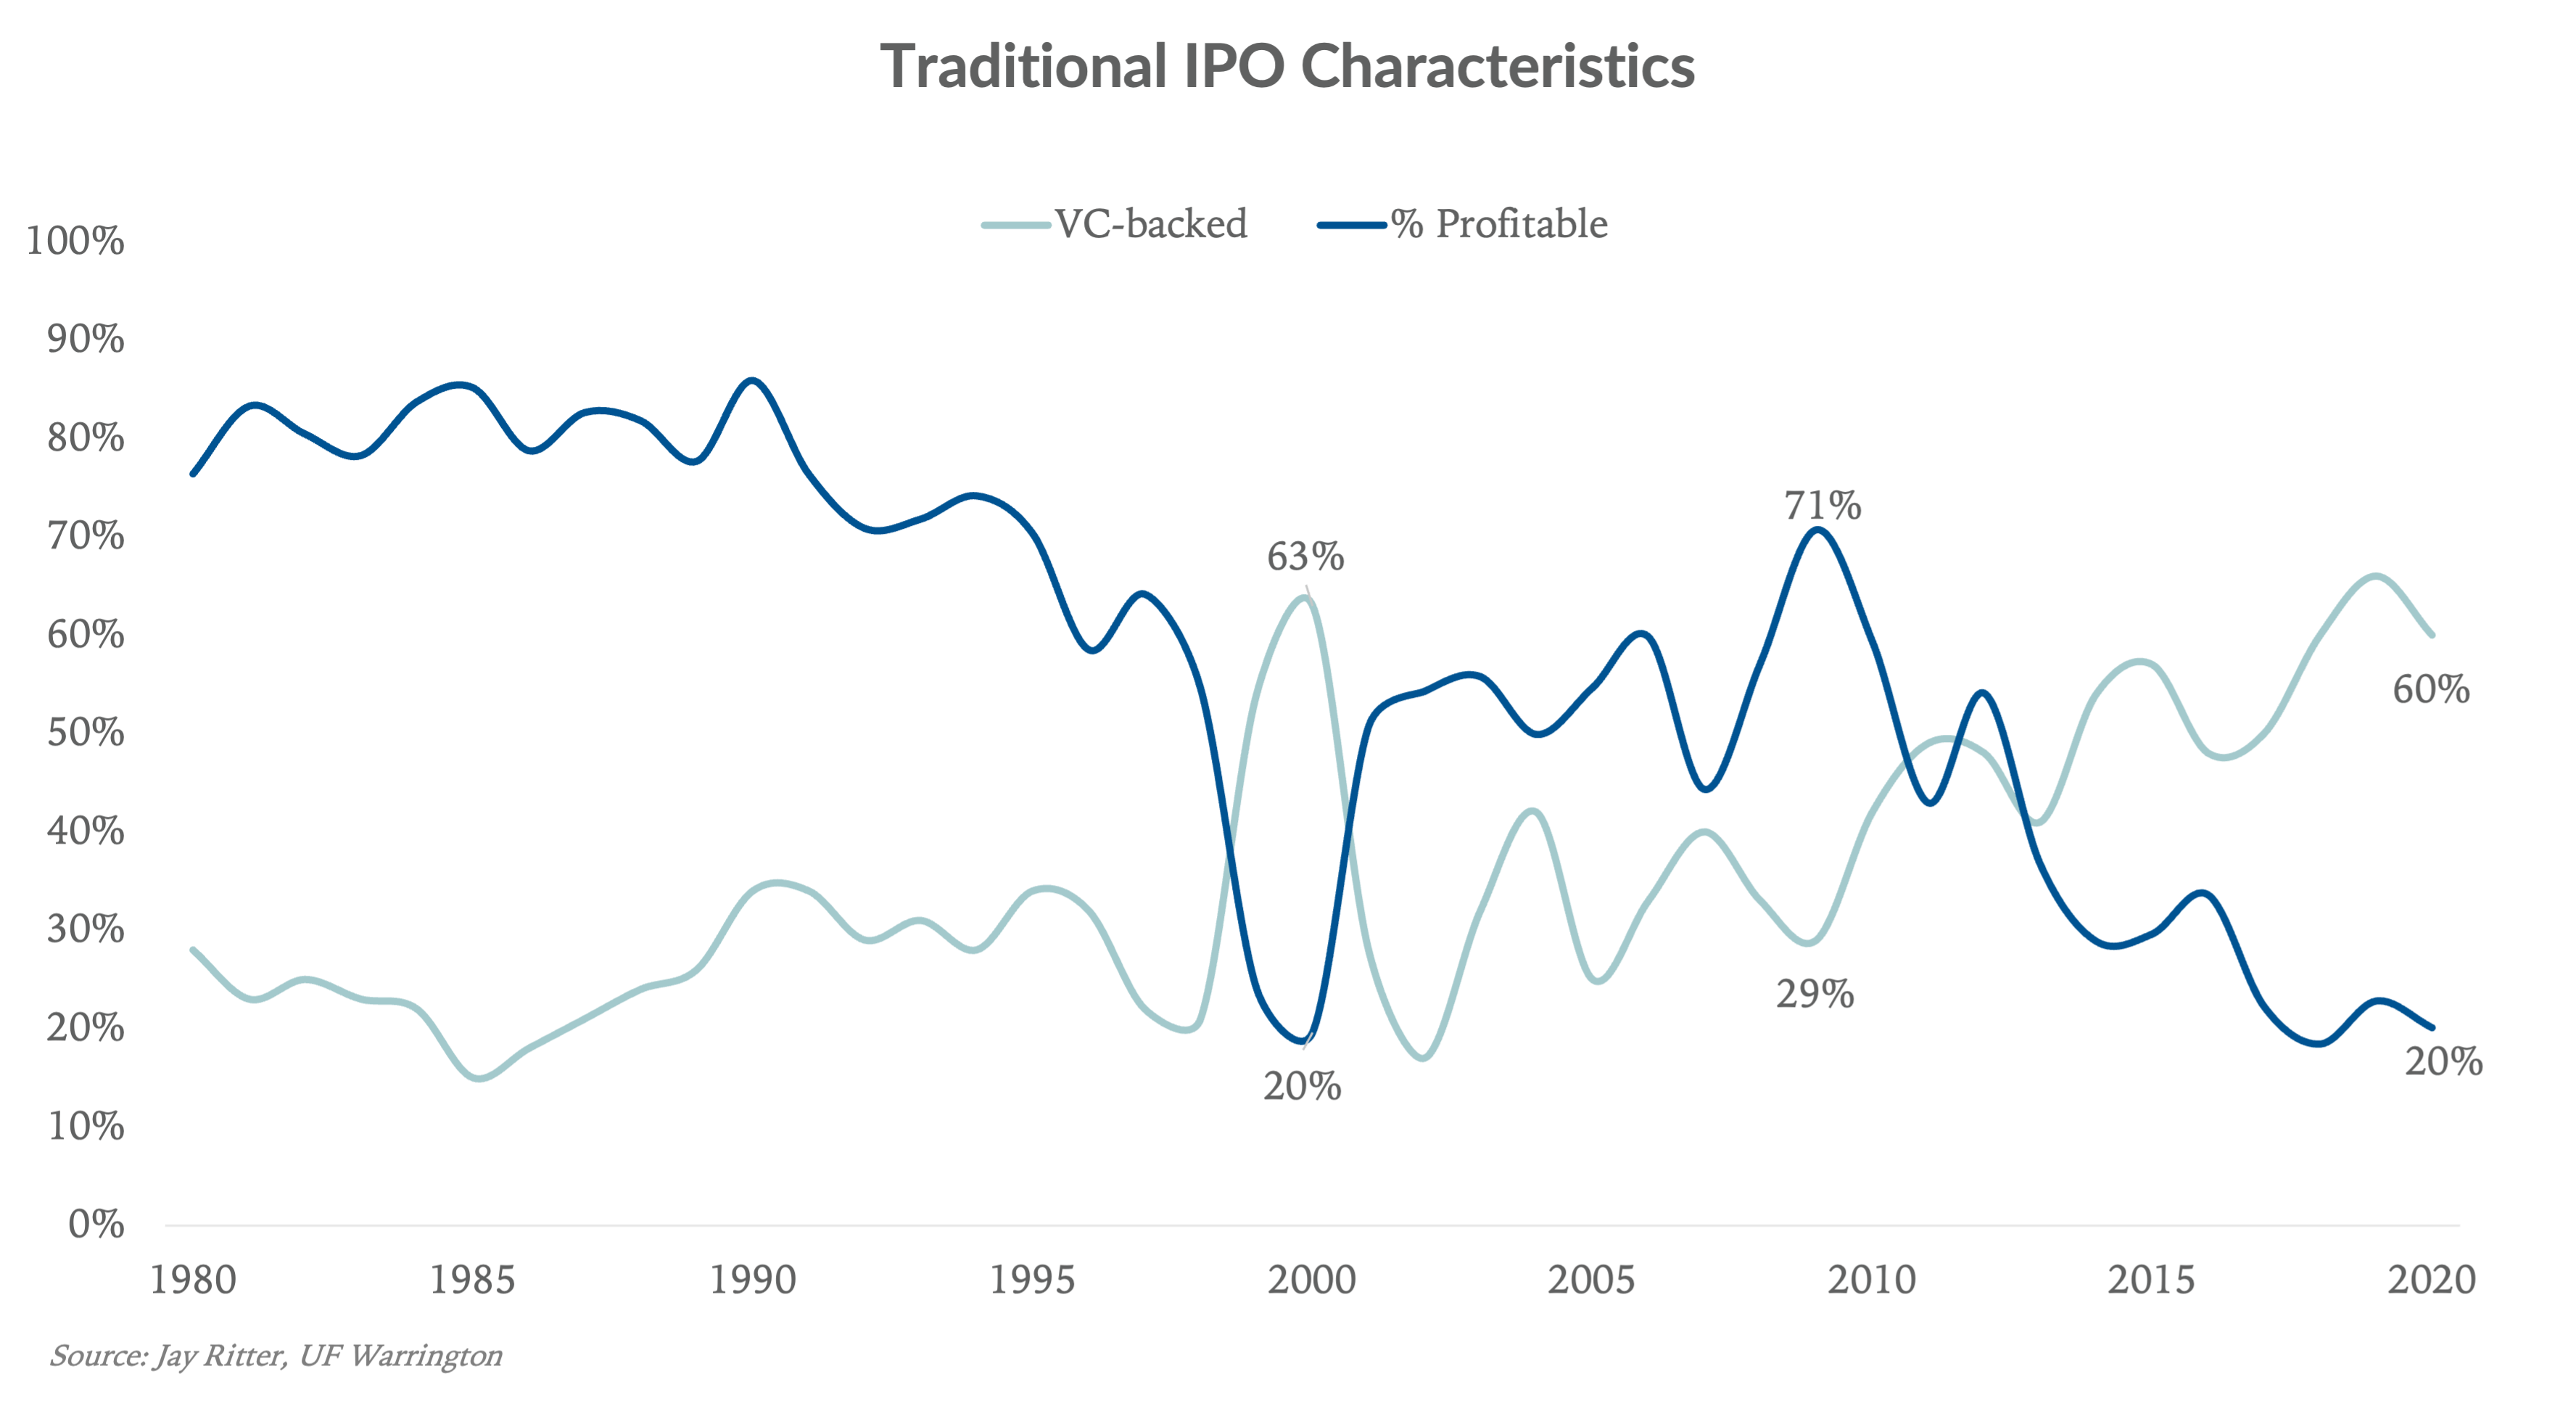
Additionally, we found about 35% of the 100 SPAC targets were profitable (defined as having at least one year of positive net income) and 65% were unprofitable. As a point of comparison, of the 164 companies that did a traditional IPO in 2020, just 20% were profitable:

The above exercise tells us a few things. First, SPAC performance is more concentrated than the broader stock market. Second, SPACs should not be thought of as one-size-fits-all. More SPAC targets are generating revenue and profits than the mainstream conversation would have you think.
Last, two things can be true at once: 1) more SPAC targets are less speculative than you might think, and 2) the sheer number of SPACs entering the market suggests investors and companies alike are trying to capitalize on a frothy public market, characterized in part by more VC-backed and unprofitable companies going public (see above chart). A greater percentage of unprofitable and VC-backed companies going public has typically coincided with a forthcoming market downturn. Time will tell if this go-round is different.
