- Apple Services is the 2nd of 4 pillars to our Apple as a Service thesis. It consists of the App Store, Apple Music, iCloud, iTunes, Licensing/Google, Apple Care, and Apple Pay.
- Critical to Services visibility is stable iPhone growth, which we believe is achievable (see note here).
- In CY18, Services should account for 14% of revenue, growing to 20% by CY23.
- Services has grown, on average, 22% y/y over the past 8 quarters and grew 31% in Mar-18, compared to iPhone units, which were flat during that period.
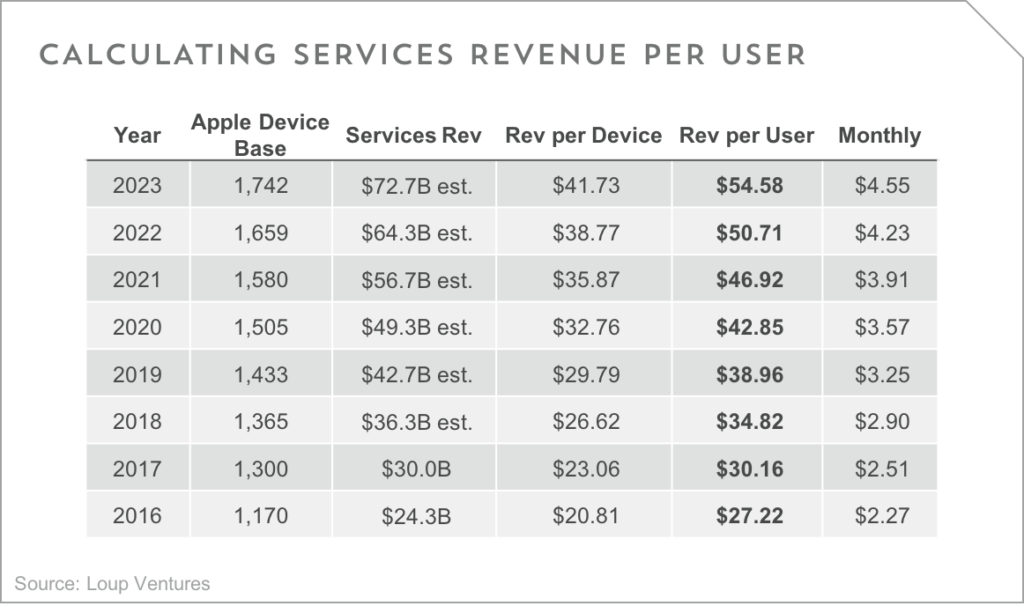
- In 2018, we estimate the annual Services revenue per user to be $34.76, up from $30.16 in 2017.
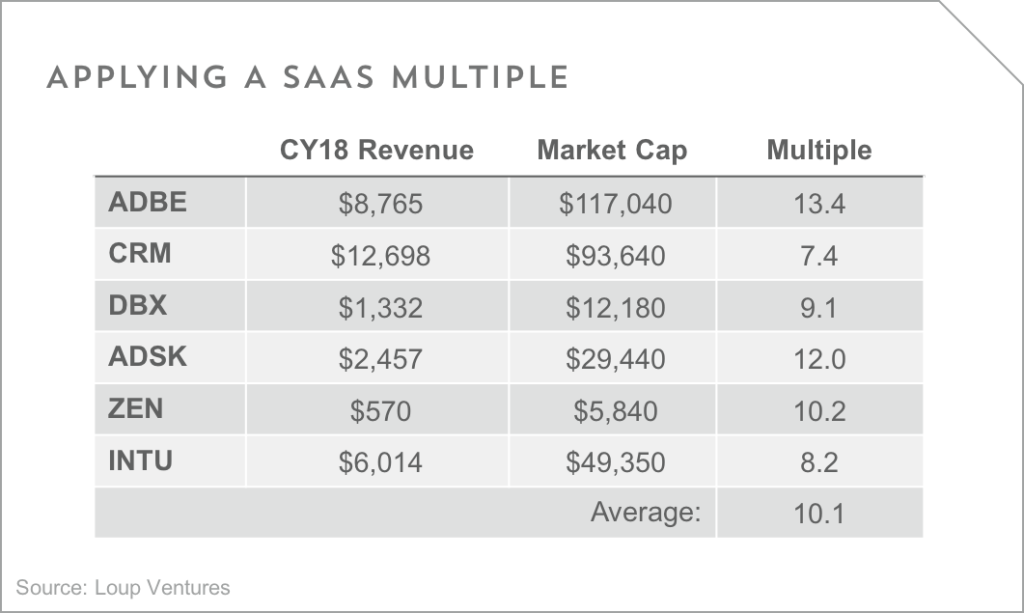
- Assuming an average SaaS multiple of 10.1x on CY18 revenue implies an Apple Services valuation of $381B.
The DNA of Apple Services. While Services differs in nature from a typical software business, the segment performs like a software business, given it has a diverse lineup of revenue categories.
Services has been a stable business for the last 12 years. It’s not about quarterly iPhone sales. Since 2006, Services revenue has averaged 23% y/y growth, a similar average growth rate to the 22% recorded over the last two years.
Apple Services is more profitable than hardware. We estimate the hardware operating margin to be 25% vs Services at 38% operating margin. This yields an overall Apple operating margin of about 27%. Looking forward, we believe overall Apple margins will be stable over the next few years as higher margins in the Services segment will be offset by lower margins in the hardware segment.
Current average revenue per user and where it goes in the future. At the end of CY17 Apple reported that they have over 1.3B active devices. We estimate the average Apple user has 1.3 Apple devices, suggesting the company has just under 1B active users (995M to be specific). We estimate the current base is growing at 5% per year. This implies the average Apple user will spend $34.76 per year, up from $30.16 in 2017. We’re modeling for that to increase to $54.58 by 2023. See details below.
What would Apple Services be worth if it were a standalone business? Most investors don’t feel comfortable applying a SaaS multiple to Apple’s Services revenue given the correlation between the active iPhone base and services growth. The fear is based on the premise that a competitive smartphone will emerge causing iPhone to lose market share, resulting in a deteriorating iPhone base that becomes a drag on the Services segment. Given our thesis that iPhone has become a stable business, we feel it is appropriate to illustrate the value of the Services business in terms of other SaaS companies. The table below summarizes what we think is an appropriate comp group. Applying the group average multiple(10x) on Apple Services 2018 estimated revenue implies a $381B valuation. Apple’s current overall market cap is $925B.
Disclaimer: We actively write about the themes in which we invest: virtual reality, augmented reality, artificial intelligence, and robotics. From time to time, we will write about companies that are in our portfolio. Content on this site including opinions on specific themes in technology, market estimates, and estimates and commentary regarding publicly traded or private companies is not intended for use in making investment decisions. We hold no obligation to update any of our projections. We express no warranties about any estimates or opinions we make.